
Introduction
Understanding customer behavior is an important part of running a successful retail business. Retailers need to know how many people visit their stores, when customer traffic reaches its peak, and how visitors move through different areas.
However, collecting this information manually can be time-consuming and inconsistent. Traditional CCTV systems help monitor store activity, but reviewing video footage does not automatically provide structured reports about customer footfall, occupancy, or visit patterns.
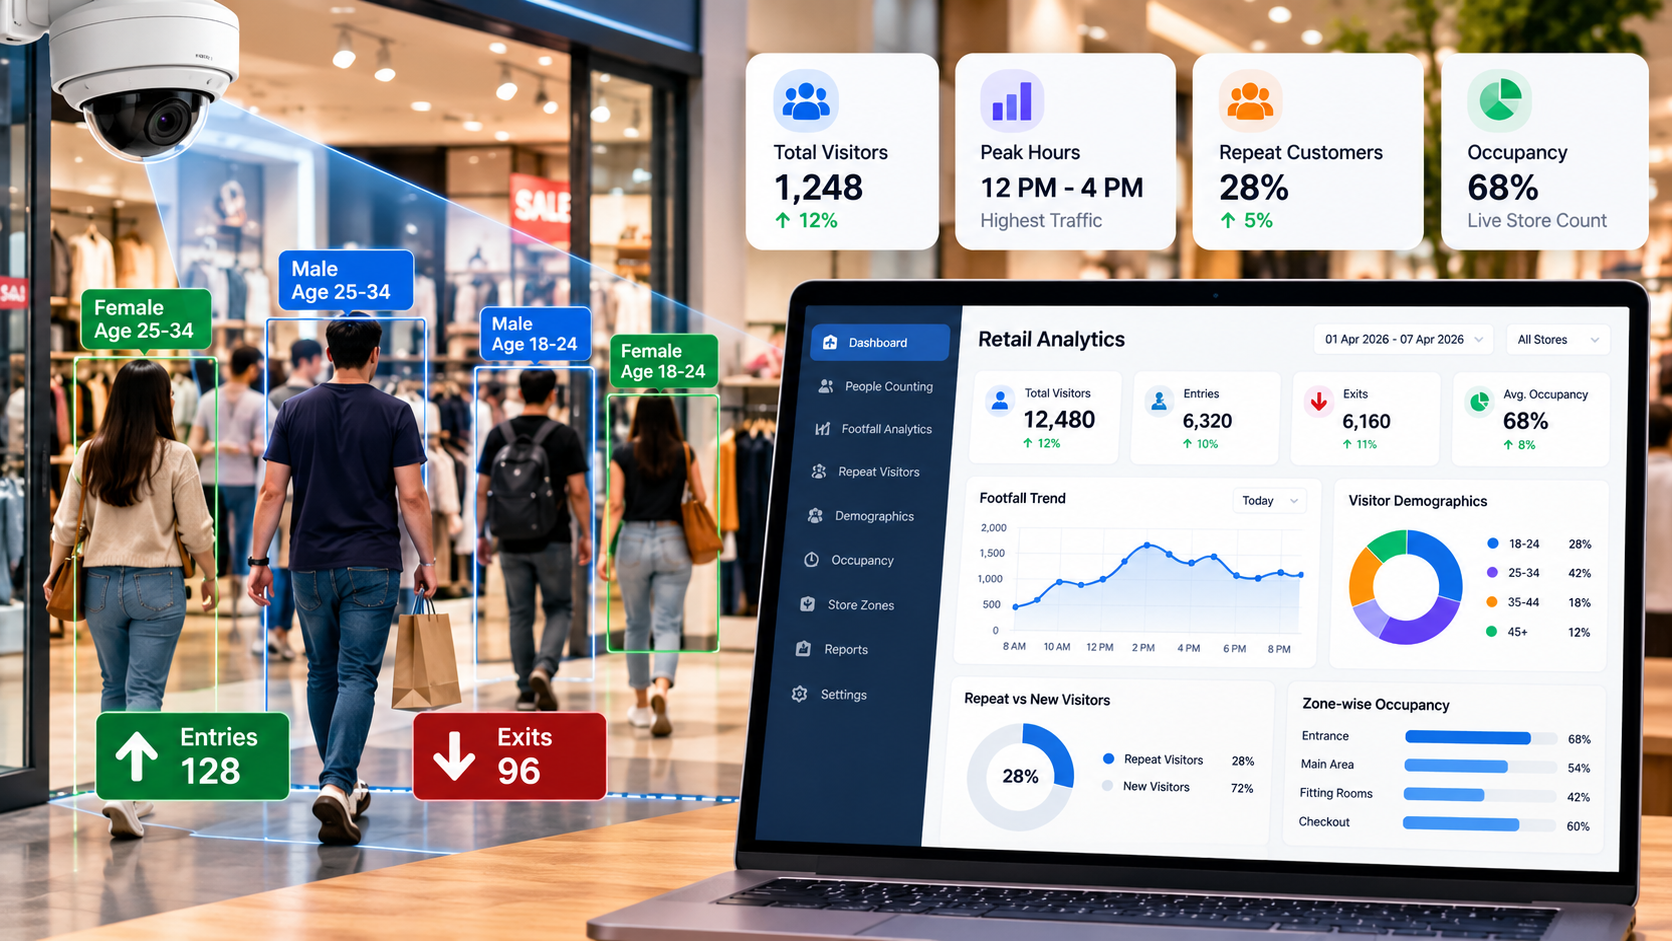
A retail people counting and customer footfall analytics system addresses this challenge by using computer vision and video analytics to turn compatible CCTV camera feeds into useful business insights.
Retailers can use this technology to measure store entries and exits, estimate occupancy, analyze traffic trends, and review aggregate demographic patterns. With suitable measurement methods, businesses can also explore repeat-visit trends through a centralized analytics dashboard.
This article explains how retail video analytics works, its key capabilities, and how businesses can use it to make more informed operational decisions.
What Is a Retail People Counting System?
A retail people counting system is a software solution that detects and tracks people in camera footage to measure visitor traffic within a store.
Using computer vision, the system processes supported video streams and identifies movement across configured entry and exit points. The resulting events can be converted into footfall reports, occupancy estimates, and historical traffic analytics.
Depending on the system's configuration, additional capabilities may include:
Customer entry and exit counting
Hourly, daily, and weekly footfall reporting
Occupancy monitoring across selected zones
Broad age-group estimation
Validated aggregate demographic analysis
Repeat-visit trend analysis using a suitable measurement method
Store traffic comparisons
Interactive dashboards and report exports
The main objective is to help retail teams understand store activity through structured data rather than relying entirely on manual observation.
Why Do Retail Businesses Need Customer Footfall Analytics?
Retail performance depends on more than sales figures. Customer traffic, store occupancy, visit frequency, and shopping patterns can provide additional context for operational decisions.
Without reliable footfall information, businesses may struggle to answer important questions.
1. Inconsistent Manual Visitor Counting
Manual counting requires employees to observe entrances or record visitor numbers. During busy periods, maintaining accurate records can become difficult.
Automated people counting helps reduce dependence on manual counting and supports more consistent visitor records.
2. Limited Visibility Into Repeat Visits
Knowing the total number of visits does not necessarily reveal how often customers return.
Retailers may want to understand whether visitor traffic includes a larger proportion of new visitors or returning visitors. This requires an appropriate cross-visit measurement method; tracking a person within a single camera session alone is not sufficient.
When implemented with suitable privacy safeguards, repeat-visit analytics can help businesses study aggregate return-visit patterns.
3. Limited Customer Demographic Insights
Retailers may need a better understanding of broad customer age-group distributions and other relevant demographic trends.
Computer vision models can estimate certain attributes when image quality and operating conditions support meaningful results. These outputs are estimates, not verified customer information, and require appropriate validation.
4. Difficulty Monitoring Store Occupancy
Some areas of a store may experience higher traffic than others. Without structured monitoring, identifying busy periods and estimating occupancy across selected zones can be challenging.
Occupancy analytics can help retail managers review traffic distribution and identify areas that may require operational attention.
5. Disconnected Reporting
Visitor counts, camera monitoring, and business reports may be maintained separately.
A centralized dashboard can bring supported metrics together, making it easier to review historical trends, compare selected locations, and access reports.
Watch Retail People Counting & Customer Footfall Analytics in Action
See how video analytics can help transform retail camera footage into structured visitor insights. From monitoring store traffic to visualizing customer footfall and occupancy, these solutions can help retailers better understand activity within their stores.
Watch the video below to explore the technology and its potential applications in retail operations.
Video: Retail People Counting & Customer Footfall Analytics
How Does Computer Vision Work in Retail People Counting?
A retail analytics system follows a sequence of video-processing and reporting steps.
Step 1: Capture Store Activity
Compatible CCTV or IP cameras capture activity at store entrances and configured monitoring zones.
Before implementation, camera placement, video quality, lighting, viewing angles, and coverage should be assessed to determine whether the footage is suitable for analysis.
Step 2: Detect and Track People
Computer vision models detect people in supported video frames. Object tracking associates detections across consecutive frames to help follow movement and reduce duplicate counts.
The quality of detection and tracking depends on factors such as camera positioning, crowd density, lighting, and partial visibility.
Step 3: Count Entries and Exits
Virtual counting lines can be configured across entrances and exits.
When a tracked person crosses a configured line in the relevant direction, the system records an entry or exit event. These events form the basis of footfall reports.
Step 4: Calculate Store Traffic Metrics
The system processes counting events to generate metrics such as:
Total entries and exits
Hourly and daily visitor trends
Weekly footfall patterns
Estimated occupancy by configured zone
Peak traffic periods
Comparisons between selected stores or time periods
Additional analytics, including broad age-group estimates and repeat-visit trends, can be enabled when suitable models, measurement methods, and validation procedures are available.
Step 5: Display Insights on a Dashboard
The processed information is presented through an interactive dashboard.
Retail teams can review charts, apply date and location filters, compare traffic patterns, monitor camera connectivity, and export historical reports.
This workflow transforms camera footage into structured information that can support day-to-day retail operations.
Key Features of a Retail Customer Footfall Analytics System
A well-designed solution can combine several capabilities within one reporting environment.
Automated People Counting
Measure visitor entries and exits through configured camera views. Automated counting can reduce manual effort and provide a consistent basis for historical traffic analysis.
Repeat-Visit Analysis
Study aggregate visitor return patterns when a suitable cross-visit measurement method is implemented.
The method should be selected carefully because ordinary object tracking within one camera session cannot establish that a visitor returned on another day.
Age-Group Estimation
Estimate broad age-group distributions from suitable camera imagery. Retailers can use validated aggregate estimates to explore how visitor patterns vary across time periods.
These results should not be treated as exact ages or verified demographic records.
Demographic Trend Analysis
Where justified and legally permitted, validated models can support aggregate demographic analysis. Appearance-based gender classification, if enabled, is an estimate and may be inaccurate or biased.
Such features require careful evaluation, appropriate privacy controls, and clear business justification.
Occupancy Monitoring
Estimate the number of people present in configured monitoring zones using supported counting and tracking logic.
Occupancy summaries can help managers review busy areas and understand how store traffic changes throughout the day.
Traffic Trend Analysis
Compare hourly, daily, and weekly footfall patterns to identify recurring peaks and changes in visitor activity.
These trends can provide useful context for staffing, store operations, and traffic management.
Centralized Analytics Dashboard
Bring visitor counts, occupancy estimates, demographic charts, and supported repeat-visit metrics into a single interface.
Depending on the implementation, the dashboard can include historical filters, store comparisons, report exports, and camera-processing status.
How Retailers Can Use Customer Footfall Data
The value of retail analytics comes from connecting visitor information to practical business decisions.
Improve Staff Scheduling
Footfall trends can help managers understand when stores experience higher visitor volumes.
For example, if historical reports consistently show increased traffic during particular hours, managers can review staffing arrangements for those periods.
Footfall data provides useful context, although staffing decisions should also consider transactions, service requirements, and other operational factors.
Evaluate Store Layouts
Occupancy and zone-level traffic information can help retailers understand how visitors are distributed across monitored areas.
Managers can use these insights to review product placement, aisle accessibility, promotional displays, and traffic flow.
Understand Visitor Return Patterns
Repeat-visit analytics can help retailers study aggregate return frequency and compare visitor patterns over time.
These insights may support customer experience initiatives and store planning. They should not be interpreted as proof of individual loyalty or purchasing intent without additional evidence.
Plan Store Operations Around Peak Traffic
Historical visitor reports can help managers identify busy periods and plan operational activities accordingly.
This may include reviewing checkout coverage, replenishment schedules, and staff availability.
Compare Performance Across Stores
For businesses operating multiple locations, consolidated reporting can make it easier to compare footfall patterns across stores, dates, and selected monitoring zones.
Managers can investigate differences and combine traffic information with sales and other business data to understand performance more comprehensively.
Technology Stack Behind Retail Video Analytics
A retail people counting solution typically combines video processing, computer vision, backend services, data storage, and dashboard development.
Technology | Role in the System |
Python | Video-processing workflows, counting logic, analytics calculations, and model integration |
Computer Vision Models | Person detection and supported age-group estimation |
Object Tracking | Tracking movement across frames and supporting directional counting |
OpenCV | Camera-stream handling and video-frame processing |
FastAPI | Backend APIs and integration between analytics services and the dashboard |
PostgreSQL / Microsoft SQL Server | Storage for counting events, camera configurations, and historical metrics |
React | Interactive dashboards, charts, configuration screens, and reports |
Cloud or On-Premises Infrastructure | Hosting and video processing based on operational and security requirements |
The appropriate architecture depends on camera connectivity, processing requirements, data-residency needs, security controls, and the retailer's existing infrastructure.
Implementation Approach: From Camera Integration to Business Intelligence
A structured implementation approach helps establish reliable video processing and useful reporting.
Phase 1: Camera Audit and Zone Configuration
The first phase evaluates existing CCTV infrastructure, camera angles, lighting, video quality, and coverage.
Entrance and exit counting lines are configured, monitoring zones are defined, and camera limitations are documented.
Outcome: A configured foundation for video processing and visitor counting.
Phase 2: People Detection and Attribute Estimation
The system introduces person detection, tracking, and directional counting logic.
Where required, optional demographic estimation models are evaluated under different lighting conditions, camera angles, and crowd densities.
Outcome: Structured counting events and validated estimates for supported analytics.
Phase 3: Footfall, Repeat-Visit and Occupancy Analytics
The processed events are converted into operational metrics, including hourly and daily footfall, entry and exit totals, and occupancy estimates.
Repeat-visit analysis is included only when an appropriate cross-visit measurement method is available.
Outcome: A structured analytics layer for supported visitor and store traffic metrics.
Phase 4: Dashboard and Business Intelligence
The final phase presents the analytics through a centralized dashboard with filters, charts, historical reports, and monitoring information.
Dashboard metrics are checked against recorded counting events to identify discrepancies.
Outcome: A unified interface for reviewing store traffic and supported customer analytics.
The estimated project duration for this solution is 8–10 weeks, subject to final requirements, camera compatibility, integration complexity, testing needs, and deployment conditions.
Privacy and Accuracy Considerations
Retail video analytics must be designed with appropriate safeguards.
Camera footage can contain personal information, and some analytics capabilities introduce additional privacy considerations.
Businesses should evaluate the following before deployment:
Data minimization: Process and retain only the information necessary for the intended business purpose.
Access control: Restrict access to camera feeds, processed data, and reports according to user responsibilities.
Retention policies: Define how long video footage and analytics records should be retained.
Accuracy validation: Test counting, tracking, and occupancy estimates under realistic store conditions.
Demographic limitations: Treat age and appearance-based gender outputs as estimates, not verified facts.
Repeat-visit methodology: Select and validate a suitable method for measuring visits across separate sessions.
Legal compliance: Review applicable privacy, surveillance, and data-protection requirements before enabling optional analytics.
Basic people counting does not require identifying individual customers. Retailers should prefer aggregate analysis where it meets the business requirement.
Expected Benefits of Retail People Counting and Footfall Analytics
When implemented and validated appropriately, the system can support several operational improvements.
Reduced manual counting effort: Automated counting can reduce reliance on manual visitor records.
Improved traffic visibility: Historical reports can make visitor trends and peak periods easier to review.
Better occupancy awareness: Zone-level estimates can help managers understand monitored-area occupancy.
Additional customer insights: Validated demographic estimates and suitable repeat-visit analytics can provide further context about visitor patterns.
More accessible reporting: Centralized dashboards can simplify historical analysis and comparisons across connected stores.
More informed operational planning: Visitor data can support decisions about staffing, layouts, and traffic management when combined with other business information.
These are expected benefits rather than measured project results. Actual performance depends on camera conditions, model validation, system configuration, and the quality of the available data.
Conclusion
Retailers need more than basic surveillance to understand how customers interact with their stores. Structured footfall and occupancy information can provide additional visibility into visitor activity and support more informed operational planning.
A retail people counting and customer footfall analytics system uses computer vision, object tracking, video processing, and interactive dashboards to turn compatible CCTV feeds into measurable store traffic insights.
From counting entries and exits to reviewing historical footfall, estimating occupancy, and analyzing supported repeat-visit patterns, the technology can help retail teams move from manual observation toward data-informed decisions.
The most effective implementation begins with a clear business objective, compatible camera infrastructure, reliable measurement methods, and appropriate privacy controls.
When these elements are addressed, retail video analytics can become a practical tool for understanding store activity and improving operational visibility.
Frequently Asked Questions
What is a retail people counting system?
A retail people counting system uses camera footage and computer vision to detect people and measure visitor entries and exits. It can generate footfall reports and, depending on configuration, occupancy estimates and additional analytics.
Can existing CCTV cameras be used for customer footfall analytics?
Yes, compatible existing CCTV or IP cameras may be used. Camera quality, viewing angles, lighting, coverage, and connectivity should be assessed before implementation.
How does retail footfall analytics work?
The system processes supported video feeds, detects and tracks people, records directional entry and exit events, calculates traffic metrics, and presents the results through a dashboard.
Can a system identify repeat customers?
A system can analyze repeat-visit patterns when an appropriate cross-visit measurement method is implemented. Tracking a person within one camera session alone is not sufficient to establish repeat visits across different days.
Can computer vision estimate customer age and gender?
Suitable models may estimate broad age groups and appearance-based gender classifications. These results can be inaccurate or biased and should be enabled only when justified, validated, and legally permitted.
How long does it take to implement a retail footfall analytics system?
The estimated duration for this solution is 8–10 weeks. The actual timeline depends on camera compatibility, analytics requirements, dashboard scope, integrations, and testing.
What is the difference between CCTV monitoring and retail video analytics?
Traditional CCTV primarily supports visual monitoring and recording. Retail video analytics processes compatible camera footage to generate structured metrics, such as entry and exit counts, traffic trends, and supported occupancy estimates.
Can retail footfall analytics improve business decisions?
It can provide useful information for reviewing staffing, store layouts, traffic management, and store comparisons. The strongest decisions combine footfall data with sales, transactions, service requirements, and other relevant business information.
Planning a Retail Analytics Solution?
Explore how computer vision and video analytics can help turn existing camera infrastructure into structured retail insights. Start by identifying the business metrics that matter most, evaluating camera compatibility, and defining the accuracy, privacy, and reporting requirements for your stores.