
It's 7:40 pm at a cement plant near Chittorgarh. The sales head calls the dispatch head: has the Pune order left, and was it complete? Answering means opening the ERP for the invoice, the WMS or the packing-plant log for the bag count, scrolling the transporter's WhatsApp group for the LR number, and phoning the security cabin to read the gate register. A 3PL in Bhiwandi faces the same call every evening, with cartons instead of bags. This is the problem that AI shipment monitoring across multiple systems is supposed to solve.
Most of the work isn't AI at all. It's data matching. The parts that make one shipment record trustworthy are a shared shipment ID that every system's references map to, one event format that every source is converted into, and events that are observed (a camera saw the truck leave) rather than typed (someone marked it dispatched). Models help at the edges: fuzzy matching of plate numbers and LR numbers, sorting exceptions, and answering plain-English questions.
This article covers that one narrow job of joining the records. If you want the wider uses of AI in logistics, see our overview of the wider uses of AI in logistics. Here you'll get a map of Indian shipment identifiers, a minimal event schema, a reference architecture your team can scope, a fair build-vs-buy view, the cost drivers, and a small first step.
Why no single system can answer "where is this shipment?"
Each system was bought to run one part of the job, and each is right about its own part. None of them was built to know what the others know. StackSync puts the result neatly: "Your TMS says delivered, the carrier says in transit, the customer's portal says nothing."
What each system owns
| System | What it knows | What it doesn't | Source of truth for |
|---|---|---|---|
| ERP | Sales order, invoice, quantity billed, promised date | Whether the goods physically left, or when | Order, price, invoiced quantity |
| WMS | Pick, pack, stage, dock assignment | The vehicle's movement after the dock | Picked and staged quantity |
| TMS | Trip, vehicle and transporter assigned, planned ETA | Whether the assigned vehicle actually came | Trip plan, transporter assignment |
| Carrier or transporter feed | In-transit milestones, proof of delivery | What was actually loaded | Delivery and POD |
| E-way bill | Consignment details; the vehicle number in Part B | Whether that vehicle is the one at your gate | Declared vehicle for the consignment |
| Gate ANPR camera | Actual plate, actual in and out time | What's inside the truck | Actual gate-in and gate-out time |
| Dock camera | Actual count loaded, with video evidence | Which invoice the goods belong to, unless joined | Actual loaded quantity |
Borrow one rule from Algoscale's guide to visibility across WMS, TMS and carriers: write down one source of truth for each attribute, and agree it before building anything. "Dispatched time" should come from the gate camera, not from a status field. "Invoiced quantity" comes from the ERP. "Loaded quantity" comes from the dock camera, with a manual override path. Algoscale also sums up the usual failure: "Most supply chain visibility tools paint a dashboard over broken data."
Where records disagree
The mismatches that cost money tend to repeat:
- The TMS says dispatched, but the truck is still inside. The trip was closed when the invoice printed, and the driver was waiting for a seal or a signature.
- The invoice says 600 bags, but 590 were loaded. A packer jammed, a loader miscounted, or bags were set aside as damaged and the invoice was never amended.
- The e-way bill vehicle changed mid-route. The transporter moved the load to another truck after a breakdown, and your TMS still shows the first vehicle.
- The LR number exists only as a photo of a handwritten receipt in a WhatsApp group.
Typed status always lags reality, and the gap grows when things are busy. On night shifts, at shift changes and when contract loaders rotate, people update the system in batches at the end of the shift. The record then shows what someone remembered to key in, at the time they keyed it in.
The shipment ID crosswalk: matching identifiers across systems
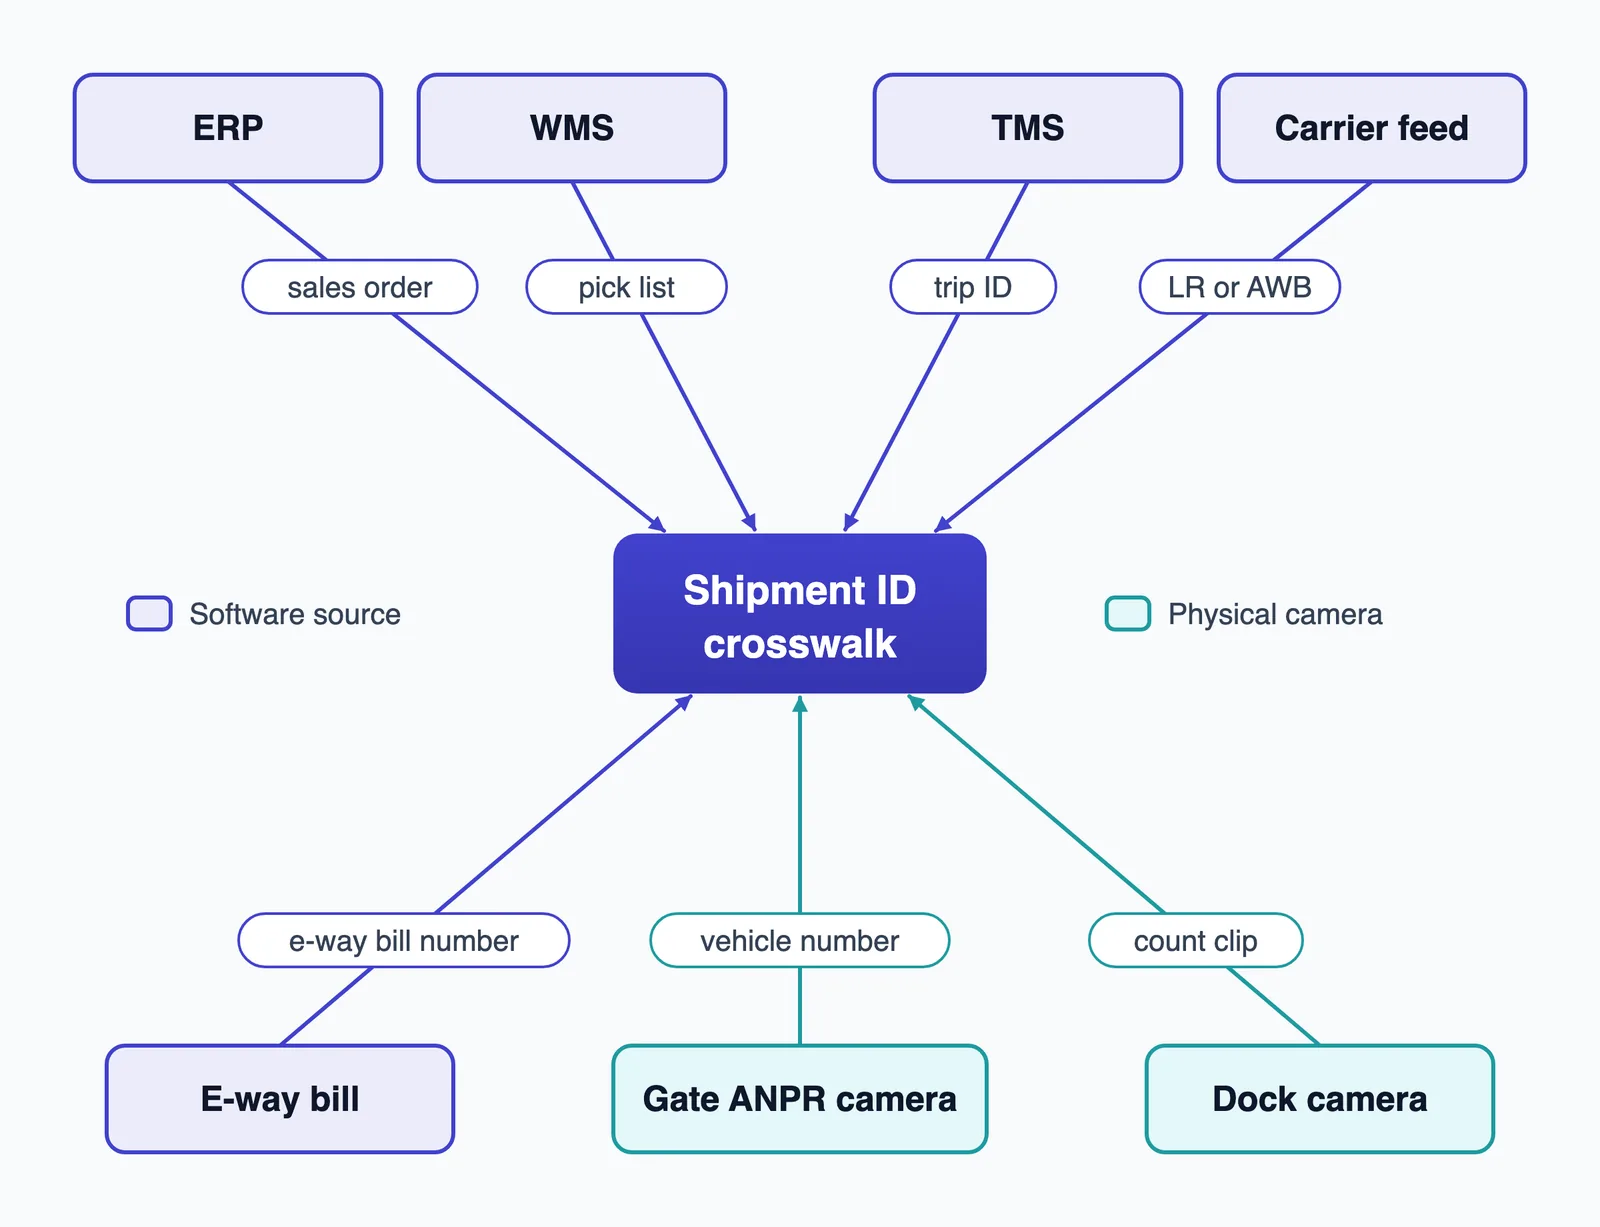
Every system has its own ID for the same physical shipment. The crosswalk is the table that says these IDs all refer to one thing. Get this wrong and the dashboard joins the wrong records, however good it looks.
Issue your own shipment ID
Create an internal shipment ID when an order is committed to a trip. Keep an append-only table that maps it to every external ID, and make every report join on the internal ID, never on an invoice or LR number directly. Algoscale's phrasing is worth pinning above your team's desks: "Tracking numbers are evidence, not identity." An LR number is a clue that a shipment exists. It isn't the shipment.
Append-only matters. When a mapping turns out to be wrong, you add a new row that closes the old one, and you don't overwrite it. That way you can always explain why a report said what it said last Tuesday.
The Indian identifiers to map
US-centric guides talk about PRO numbers and EDI messages. An Indian dispatch has a different set of identifiers:
| Identifier | Created by | When | Typical problems |
|---|---|---|---|
| Sales order | ERP | Order booking | One order split across several trips; amended quantities |
| Delivery or challan number | ERP or WMS | Delivery creation or stock transfer | Manual challan books at depots; separate series per plant |
| Tax invoice | ERP | Billing | Raised before loading finishes; one invoice across two vehicles |
| E-way bill number | E-way bill portal, often through ERP integration | Before movement | Vehicle in Part B updated after dispatch |
| LR, GR or docket number | Transporter | Booking or loading | Handwritten, different format per transporter, sent as photos or free text |
| Vehicle registration number | Transporter, entered in TMS; read by ANPR | Vehicle assignment and gate | Typos, spacing, replacement vehicles, camera misreads |
| Container number | Shipping line or CFS | Export or import moves | Container swapped at the CFS |
| Carrier AWB | Courier or express carrier | Parcel and part-load booking | One shipment, many AWBs |
Look at the vehicle number. It's the only key shared by the software world (the TMS trip and e-way bill Part B) and the physical world (the ANPR read at your gate). That makes it the bridge between what was declared and what was observed, and it's why gate cameras are worth more than they first appear.
Mappings that change over time
Shipments split, part-load, cross-dock and change vehicles. Part B of the e-way bill holds transporter details such as the vehicle number, and according to Quicko's guide to updating Part B, the current transporter can update it as many times as needed within the validity period. That guide is a third-party page last updated in 2021, so check current rules on the e-way bill portal. This isn't legal or tax advice.
The practical point is that a mapping from vehicle to shipment holds only for a time window. The same truck does a Chittorgarh–Pune run this week and a Chittorgarh–Indore run next week. So every crosswalk row carries a valid_from and valid_to, as Algoscale recommends, and a gate read only joins to a trip if it falls inside that window.
Where AI helps the matching, and where it shouldn't decide
Run the deterministic joins first: exact invoice to e-way bill, exact trip to vehicle. These cover most records and need no model. Then use fuzzy or ML matching for the messy remainder:
- Plate misreads and typos. Normalise case and spacing, then score likely confusions such as 0/O, 8/B and 1/I.
- Transporter name variants. "Shree Ganesh Roadlines", "Sri Ganesh Road Lines" and "SGRL" are probably the same firm.
- Free-text LR numbers pulled from transporter messages or photos of receipts.
Score every match. Above a threshold you set, merge it automatically. Below it, send it to a human review queue and don't auto-merge. A wrong merge is worse than a missing one, because it makes the dashboard confidently wrong. Track the queue size; if it grows, a rule or a camera angle needs fixing.
A canonical shipment event model: one format for every source
Once IDs resolve, every source has to speak the same language. Otherwise you write a custom join for every pair of systems, and the number of pairs grows quickly.
What, when, where, why
A useful template is GS1's EPCIS, which GS1 describes as "a GS1 Standard for Visibility Data", where each event is "a record of something that happened to the object in the real world". It describes events along four dimensions: what, when, where and why. You don't need to adopt EPCIS in full. Its framing works for every source, cameras included: a camera count is simply a "what happened, when, where" record with a video clip as evidence.
A minimal canonical shipment event
| Field | Meaning |
|---|---|
shipment_id | Your internal ID, from the crosswalk |
event_type | One value from an agreed list (below) |
event_time | When it happened in the real world |
recorded_time | When your system received it |
location | Plant, dock or gate code |
source_system | ERP, WMS, TMS, transporter, EWB, ANPR, dock camera |
source_ref | The ID in that system (invoice no., read ID, message ID) |
observed_vs_declared | Observed by a sensor, or declared by a person or system |
confidence | Match or detection confidence, 0 to 1 |
evidence_ref | Link to a clip or image, if any |
raw_payload | The original message, kept unchanged |
A starting list of event types: order_committed, picked, packed, staged, vehicle_gate_in, loading_started, loaded_count, vehicle_gate_out, eway_bill_vehicle_updated, carrier_milestone, delivered, pod_received. Keep the list short and add to it deliberately.
An illustrative dock camera event might look like this:
{
  "shipment_id": "SHP-2026-118432",
  "event_type": "loaded_count",
  "event_time": "2026-11-12T19:22:10+05:30",
  "recorded_time": "2026-11-12T19:58:41+05:30",
  "location": "CHT-DOCK-03",
  "source_system": "dock_camera",
  "source_ref": "cam03-seq-55120",
  "observed_vs_declared": "observed",
  "confidence": 0.93,
  "evidence_ref": "clips/cht/dock03/55120.mp4",
  "raw_payload": { "count": 590, "expected": 600 }
}
Keeping raw_payload matters. When a transporter disputes a short shipment three weeks later, you want the original message, not your interpretation of it.
Late, duplicate and out-of-order events
At Indian plants, internet drops and power cuts are normal. Edge devices at the gate and dock must buffer events locally and replay them when the link returns, which means events arrive late, in bursts and out of order. In the example above, the count happened at 7:22 pm but arrived at 7:58 pm.
That's why the schema has two clocks. event_time orders what happened. recorded_time lets you answer "what did we know at 6 pm?", which is what you need when someone asks why an alert didn't fire. Algoscale calls this a temporal store. Deduplicate on source system, source reference and event time, because replayed buffers will resend events.
Adding physical-world events from cameras and gates
Software only records what someone typed. Cameras record what happened. Treating gate reads and loading counts as first-class events in the shipment record is the biggest gap in most visibility designs, and it's where Indian plants have the most to gain, because many transporters will never have an API.
ANPR gate-in and gate-out times
In AtlasML's ANPR vehicle entry and exit logging approach, each read records the plate, timestamp, camera or location, vehicle and plate images, and whether it's an entry or exit. Plates are compared against vehicle lists or connected systems. In the shipment record, each read becomes a vehicle_gate_in or vehicle_gate_out event, joined to the TMS trip and the e-way bill vehicle inside the crosswalk's time window.
The useful output is the exceptions:
- a vehicle gated out with no open trip
- a trip marked dispatched with no gate-out read
- a plate at the gate that doesn't match the vehicle in e-way bill Part B
- a trip with gate-in but no gate-out after several hours
Camera-verified loading counts against the invoice
In AtlasML's camera-based loading and unloading monitoring design, cameras count cartons, boxes or pallets moving into or out of vehicles, compare the count with shipment documents, alert supervisors to a mismatch before the truck leaves, and store timestamped clips for each shipment. It connects to a WMS or ERP where supported interfaces exist. In the shipment record, this becomes a loaded_count event with an evidence_ref pointing to the clip. How the counting models work is covered in our article on computer vision for loading, unloading and shipment verification.
Treat camera events as evidence, with a confidence score
A camera event isn't automatically right. Give it a confidence value, and give supervisors a manual override that is itself logged as an event. Dust at cement and steel docks, afternoon glare on gate cameras, monsoon rain on lenses and poor night lighting all lower confidence. When a camera keeps producing low-confidence events, the fix is usually physical: re-angle it, add a hood, add lighting, or mount a camera closer to the dock edge.
Existing CCTV often works when the view allows. Most NVRs and IP cameras on Indian sites can provide streams over RTSP, and many support ONVIF. Whether a particular camera's view is usable for counting or plate reading has to be checked camera by camera; brand alone doesn't tell you.
Privacy
Loading counts don't need anyone's identity, so keep them face-free: count objects, not people, and don't store face crops. Plate logs relate to vehicles and their owners or drivers and may count as personal data, so decide retention periods, limit access, and take advice on your obligations before rolling out. This isn't legal advice.
Once gate and dock events exist, you can build yard and dock analytics such as truck queues and turnaround on the same data. We cover those separately.
See It Working: Truck Gate Events Captured by ANPR on CCTV
In this demo, computer vision runs on a plant gate's existing CCTV feed. It detects a vehicle entering, classifies it as a truck, reads the number plate automatically (98% recognition confidence in this clip) and checks the plate against the approved vehicle list. Then the barrier lifts and the entry is timestamped and logged. That timestamped gate record, tied to a plate number, is the kind of physical-world event you can match to a shipment through the ID crosswalk, with no guard writing it in a register.
Want gate events like this feeding your own shipment record? Call +91 95372 90206 or message us on WhatsApp and we'll walk you through it.
Plain-English questions over the shipment record with Text-to-SQL
A dispatch head shouldn't need to write SQL to ask why a customer is complaining. A Text-to-SQL layer turns a typed question into a database query and returns the answer as a table.
Point it at a curated view, not the raw source tables
Build two views with plain business names: shipments (one row per shipment, with current state) and shipment_events (one row per event). Let the Text-to-SQL layer query only those. The questions it can answer then look like this:
- "Which trucks left Sanand yesterday with a count mismatch?"
- "Average gate-in to gate-out time by transporter this month"
- "Orders invoiced but not gated out after 24 hours"
Whether Text-to-SQL is the right pattern for your data at all is a separate decision, covered in our guide to choosing between Text-to-SQL, a semantic layer, RAG and MCP.
How accurate is it?
Not as accurate as a person yet. On the BIRD Text-to-SQL benchmark, human performance (data engineers and database students) is 92.96% execution accuracy. The top test-set entries in 2026 sit around 82–83%, with AskData at 83.40. Early large language models scored far lower when the benchmark was first published. BIRD uses large, messy databases. A narrow schema with clear names makes the job easier, which is another reason to use curated views rather than exposing 400 ERP tables.
Guardrails
Because some answers will be wrong, design for checking:
- Read-only execution on a separate user that can't change data
- Validation before a query runs: syntax, allowed tables, row limits
- Show the generated SQL next to the answer so an analyst can check it
- Log every query to spot bad patterns and missing view columns
This matches the approach in AtlasML's read-only Text-to-SQL interface, which uses a schema catalogue, dialect checks, validation before execution, an SQL preview and query history across SQL Server, PostgreSQL and MySQL.
A reference architecture for AI shipment monitoring across multiple systems
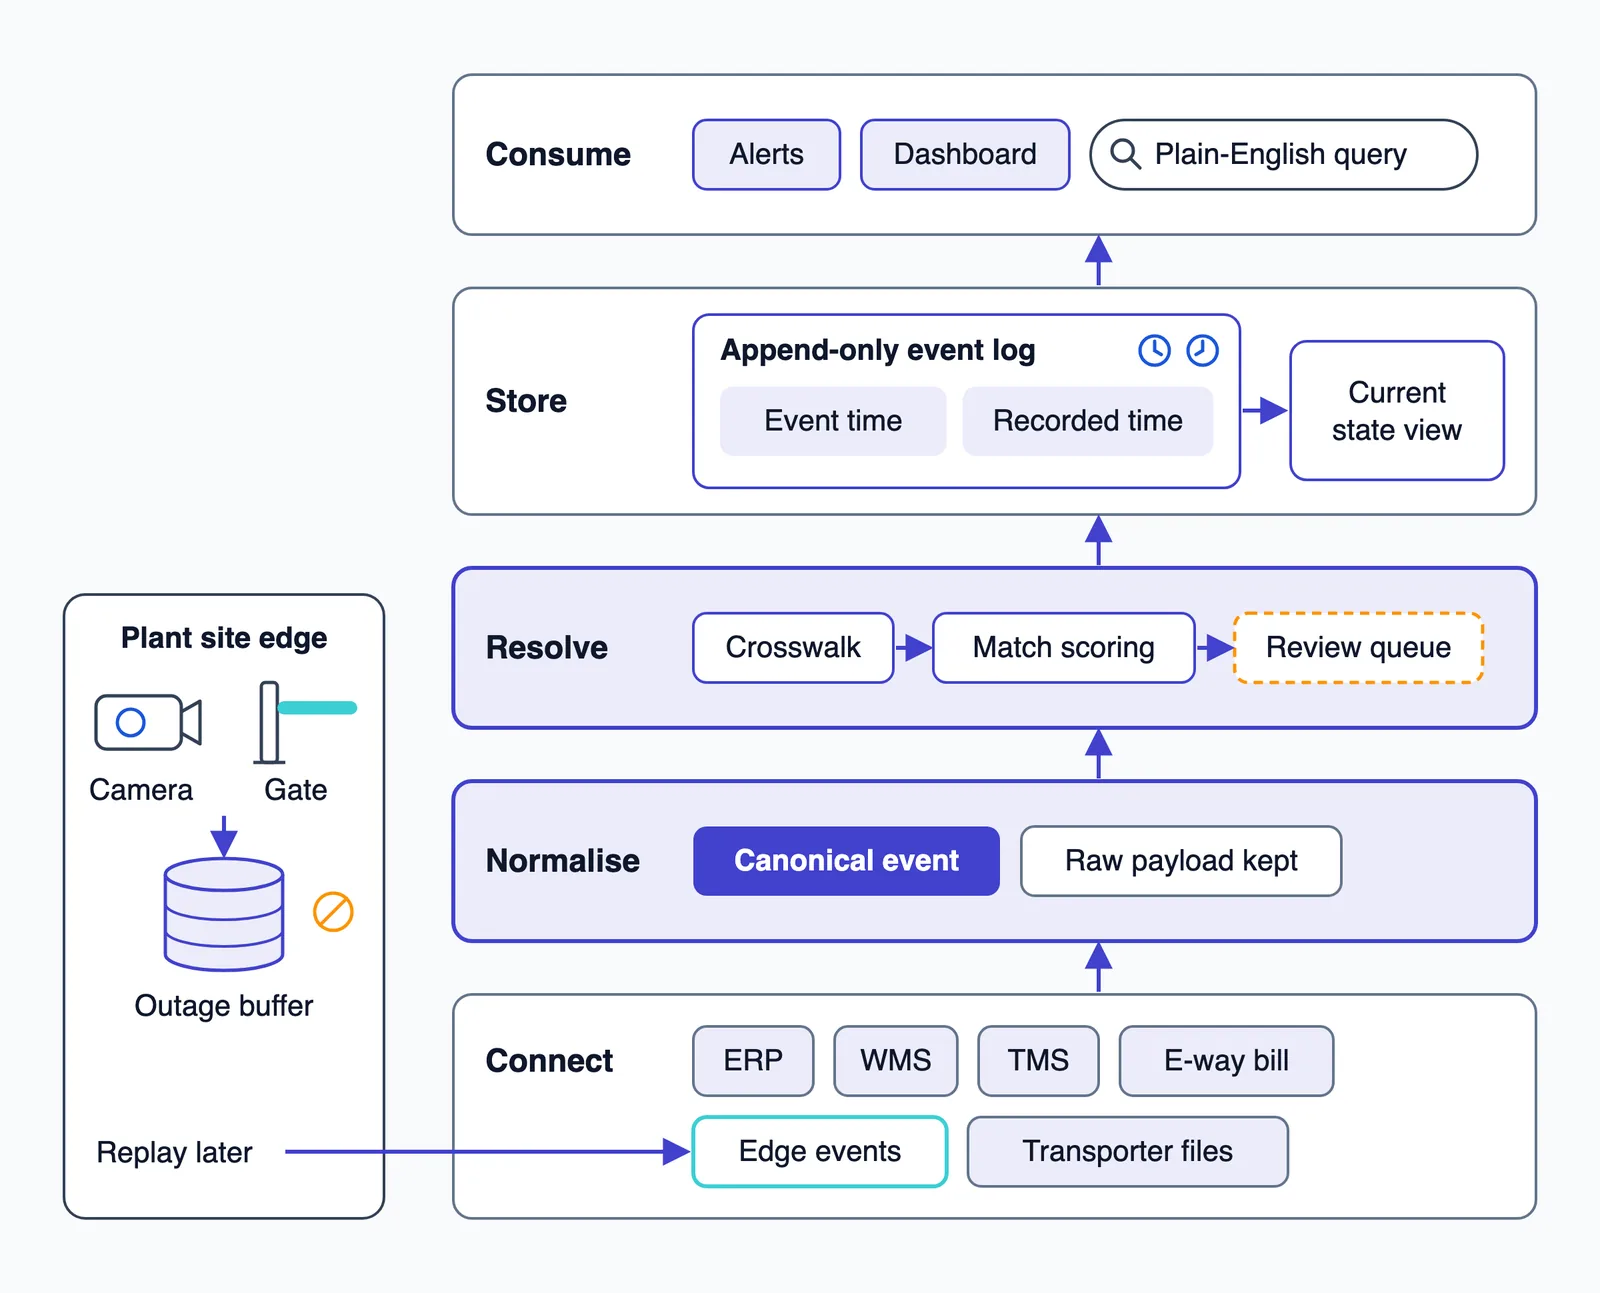
Algoscale describes a five-layer pattern (Connect, Centralize, Conform, Consume, Govern). Adapted for Indian plants, with physical events added, it looks like this:
- Connect. Adapters for ERP, WMS and TMS; carrier APIs where they exist and file or email drops where they don't; transporter messages; the e-way bill; edge events from ANPR and dock cameras.
- Normalise. Convert every input into the canonical event, keeping the raw payload.
- Resolve. Apply the crosswalk: deterministic joins, then scored fuzzy matches, with a review queue for low-confidence ones.
- Store. An append-only event log with both event time and recorded time, plus a current-state view derived from it.
- Consume. Alerts, a dashboard, and Text-to-SQL over the curated views.
The Store and Consume layers are standard data engineering and analytics pipelines. The hard design work sits in Normalise and Resolve.
Latency tiers
Not every event needs to be real time. Algoscale's three tiers help you avoid paying for speed you don't use:
| Tier | Target | Example |
|---|---|---|
| Decision | Under 5 minutes | Count mismatch flagged before the truck reaches the gate |
| Operational | Under 1 hour | Reallocating docks when trucks bunch up |
| Analytical | Under 24 hours | Transporter scorecards, OTIF reports |
Decision-tier events can't depend on the internet. That decides where things run.
What runs where
Camera and ANPR inference runs on an on-premise server or edge device at the plant, so a mismatch alert fires even when the link is down. Only events and short clips go upstream, not continuous video. The resolver, event store and query layer can run on-premise or in the cloud, depending on your IT policy and how many sites you're joining.
An optional government data source: ULIP
India's Unified Logistics Interface Platform (ULIP) exposes data from government logistics systems through APIs. As of April 2023, Maritime Gateway reported 33 systems from seven ministries integrated through more than 106 APIs covering over 1,600 data fields, with 76 companies having signed NDAs. By May 2024, FII News reported 37 systems from 10 ministries via 118 APIs covering over 1,800 data fields, over 900 registered companies, and more than 35 crore API transactions.
Access isn't instant. The reported process is to register, submit use cases for review, sign an NDA, develop against the APIs, then pass a security check and integration testing. Check which systems are currently available for your use case before you plan around it.
Logistics control tower: build, buy or combine?
Commercial visibility platforms, the kind listed in Locus's 2026 round-up, are good at a standard job: tracking milestones across large carrier networks that already expose APIs or telematics. If most of your freight moves with organised carriers and your main question is "where is the truck now?", a platform is usually faster and cheaper than building.
Custom work suits the non-standard parts:
- physical events from your own gate and dock cameras
- local transporters with no API, who send WhatsApp messages and receipt photos
- your own ERP customisations and plant-specific document series
- Indian document identifiers such as challans, e-way bills and LRs, mapped with time windows
Many firms end up with a hybrid: a platform for carrier milestones, and their own crosswalk, camera events and query layer around it. The platform's milestones become one more source in the Connect layer.
| Need | Platform fits | Custom fits |
|---|---|---|
| In-transit tracking across API-connected carriers | Yes | Rarely worth building |
| Gate-in and gate-out from your own cameras | Usually not covered | Yes |
| Loaded count with clip evidence per invoice | Usually not covered | Yes |
| Transporters with no API | Partial | Yes |
| E-way bill, LR and challan matching | Depends on the vendor | Yes |
| Plain-English queries over your own joined data | Depends on the vendor | Yes |
Effort, cost drivers and payback
We won't quote a figure without seeing your sites. Effort is set by a handful of drivers, and you can list most of them yourself before talking to anyone:
| Cost driver | Why it moves effort |
|---|---|
| Number of source systems | Each needs an adapter and a mapping to the canonical event |
| API or export only | Scheduled exports are cheaper to start with but add latency; screen-scraping is fragile |
| Transporter count and formats | Each format of LR or message needs parsing rules or extraction |
| Cameras needing re-angling or new mounts | Site work, cabling and lighting often cost more than the model |
| Number of gates and docks | Sets edge hardware and per-site tuning |
| Latency tier needed | Decision-tier alerts need on-site inference and buffering |
| On-premise or cloud | Changes hosting, security review and upkeep |
| Review-queue staffing | Someone has to clear low-confidence matches every shift |
On timelines, an AtlasML proof of concept can be ready in 4 weeks. Most projects run 8 to 16 weeks from kickoff to production, and complex multi-model systems, which a full ERP plus ANPR plus dock camera plus Text-to-SQL build usually is, run 12 to 20 weeks. Every project includes 90 days of post-launch support and monitoring. See AtlasML's delivery timelines and post-launch support.
For the promoter approving the spend, payback comes from a few mechanisms you can measure on your own data:
- Fewer short-shipment disputes, because a timestamped clip shows what was loaded against each invoice
- Less time chasing transporters by phone for LR numbers and status
- Detention and dwell made visible from actual gate-in and gate-out times, which supports conversations with transporters about waiting charges
- Faster OTIF reporting, because "on time" and "in full" come from observed events rather than end-of-shift entries
Count your current disputes and the hours spent on follow-up calls before you start. Without that baseline you'll have nothing to compare against.
How to start: one dock, one gate, one export
- List every source, including spreadsheets, security registers and WhatsApp groups. The informal ones often hold the LR numbers.
- Trace 50 recent shipments by hand. This is Algoscale's identity audit. For each, find the order, invoice, e-way bill, LR and vehicle, and note where the trail breaks. That shows you where the joins will fail.
- Agree the event list and the source of truth per field, in writing, with dispatch, finance and security in the room.
- Add ANPR at one gate and a count camera at one dock. Use existing CCTV if the views allow.
- Load one ERP or TMS export, even a daily file, into the canonical format.
- Run Text-to-SQL on the curated views and let the dispatch team ask their own questions.
- Measure the mismatches found: count gaps, vehicle mismatches, trips dispatched on paper but still inside. Then decide whether to scale to more gates, docks and systems.
If step 2 already turns up enough broken trails to worry you, that alone is a reason to build the crosswalk, with or without cameras.
Frequently asked questions
Can AI monitor shipments across TMS, WMS and ERP without replacing those systems?
Yes. Each system stays the source of truth for its own fields: the ERP for orders and invoices, the WMS for picking and staging, the TMS for trips. A separate layer copies their events, maps their IDs to one internal shipment ID and builds the joined record. Nothing in the existing systems has to change, though read access or regular exports are needed.
What is a shipment ID crosswalk, and why does it matter more than the dashboard?
A shipment ID crosswalk is an append-only table that maps your internal shipment ID to every external ID: sales order, challan, invoice, e-way bill, LR, vehicle number and AWB, each with a valid-from and valid-to window. Without it, a dashboard joins the wrong records, for example a truck's gate read to last week's trip, and shows confident but wrong answers.
How do CCTV and ANPR cameras improve shipment tracking?
They add observed events to a record that otherwise holds only typed ones. ANPR gives the actual gate-in and gate-out time for a vehicle number, which can be checked against the TMS trip and the e-way bill vehicle. A dock camera gives the actual loaded count with a video clip, which can be checked against the invoice before the truck leaves.
Can managers ask shipment questions in plain English?
Yes, with a Text-to-SQL layer over curated shipment views. Accuracy is good but not perfect: on the BIRD benchmark, the best systems score around 82–83% execution accuracy against a human baseline of 92.96%. Keep the layer read-only, show the generated SQL next to each answer, and log every query.
Should we buy a shipment visibility platform or build our own?
Platforms suit carrier-milestone tracking across carriers that already have APIs. Custom work suits physical events from your own cameras, local transporters with no API, ERP customisations and Indian identifiers such as e-way bills, LRs and challans. Many firms combine both, feeding platform milestones into their own crosswalk and query layer.
How long does it take to build one shipment record across systems?
With AtlasML, a proof of concept can be ready in 4 weeks. Most projects run 8 to 16 weeks from kickoff to production, and complex multi-model systems 12 to 20 weeks. Cost depends on the number of source systems, whether they have APIs, how many transporters and formats you deal with, how many cameras need work, and how fast alerts must fire.